Monitoring Home Network With Grafana, Loki, Prometheus, and Alloy in Docker (part 2)
In part 1, we discussed setting up Grafana, Loki, and Alloy. Here, we’ll dive into Prometheus setup.
Prometheus differs from Loki in that Loki stores individual log entries. Prometheus is a time-series database: it stores individual events (each of which can be tagged with specific labels) and it is specialized for running analysis, bucketing, and summaries on events.
The steps here, relative to what we’ve built, are pretty straightforward:
- Install Prometheus
- Configure our nodes to output metrics to Prometheus
- Configure Grafana to see our Prometheus install
Install Prometheus
To start, we can extend the docker-compose.yml file that we prepped to run Loki and Grafana with a Prometheus service.
  prometheus:
    restart: always
    image: prom/prometheus:latest
    ports:
      - 9090:9090
    volumes:
      - type: bind
        source: ./prometheus.yml
        target: /prometheus/prometheus.yml
    command:
      - "--web.enable-remote-write-receiver"
      - "--enable-feature=remote-write-receiver"
    networks:
      - loki
And we need a config file. Same directory as the docker-compose file:
global:
  scrape_interval: 15s
  evaluation_interval: 30s
  body_size_limit: 15MB
  sample_limit: 1500
  target_limit: 30
  label_limit: 30
  label_name_length_limit: 200
  label_value_length_limit: 200
  query_log_file: query.log
  scrape_failure_log_file: fail.log
  # scrape_timeout is set to the global default (10s).
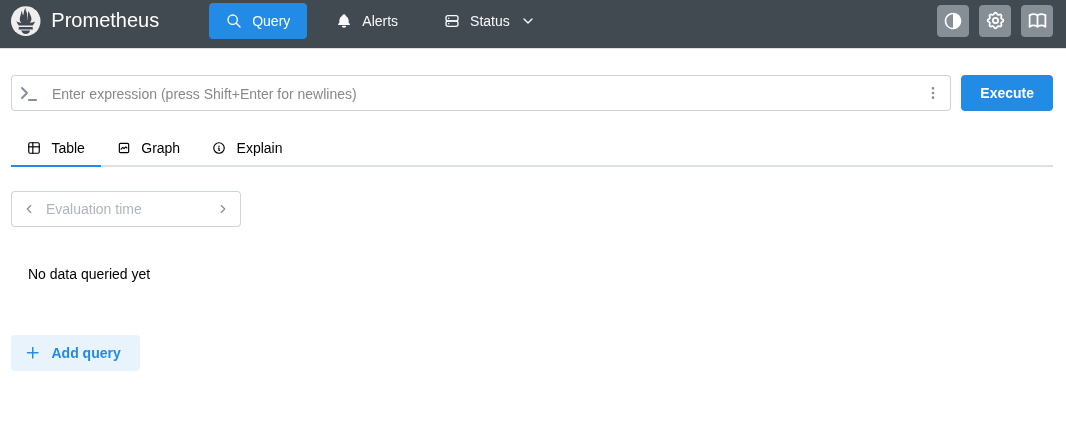
Once those are in place and we docker compose up, we can spot-check by hitting port 9090 in the web browser. If this looks good, our Prometheus engine is up.

Configure nodes to output metrics to Prometheus
We already have config.alloy file set up from our previous configs, we just need to add some additional clauses to it to have Alloy gather and output Prometheus metrics.
prometheus.exporter.unix "hoststats" {
    enable_collectors = ["cpu","meminfo"]
    sysfs_path  = "/host/sys"
    procfs_path = "/host/proc"
    rootfs_path = "/host/rootfs"
    include_exporter_metrics = true

}

prometheus.scrape "hostscraper" {
    targets = prometheus.exporter.unix.hoststats.targets
    forward_to = [prometheus.remote_write.prometheusout.receiver]
}

prometheus.remote_write "prometheusout" {
    endpoint {
        url="http://prometheus-host:9090/api/v1/write"
        write_relabel_config {
            target_label = "node"
	        replacement = sys.env("NODE_NAME")
	    }
    }
}
(… where prometheus-host is the address of the machine running Prometheus).
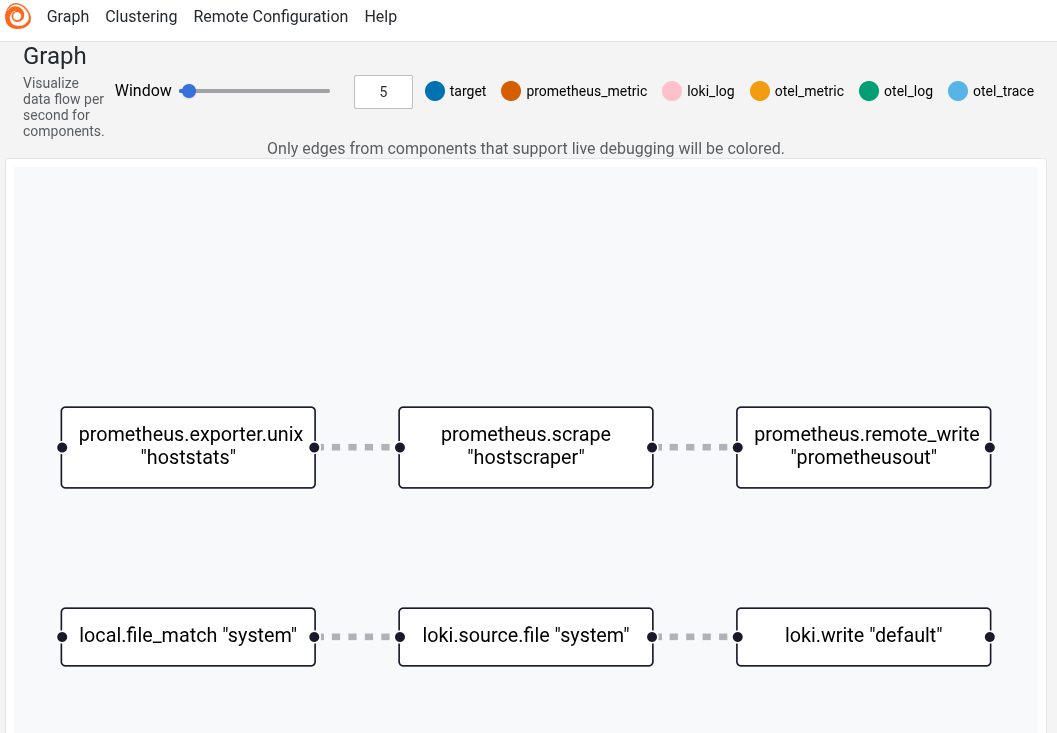
This pipeline works similarly to the Loki pipeline: The exporter specifies what to monitor (and where to pull it from), the scrape forwards the data from the exporter to the writer, and the writer emits the stat (tagging it with an additional label, “node,” specifying which of my nodes it came from).
docker-compose.yml file for Alloy.
After restarting the Alloy node, the Alloy UI will indicate the new data pathway.

Configure Grafana to see our Prometheus install
Now that we’re all set up, we just have to bind Grafana. The configuration change is pretty straightforward: in the docker-compose.yml file with the grafana service, find the entrypoint where we build a script to configure datasources and add one additional chunk here:
        - name: prometheus
          type: prometheus
          access: proxy
          orgId: 1
          url: http://casaos.home:9090
          incrementalQueryOverlapWindow: 10m
Now, here’s the unfortunate part: to actually get this change to stick, you have to remove and re-create the Grafana container, which will blow away all your customizations. This is because Grafana loads the contents of the ds.yaml file into an internal database after first-run, so changing the file has no effect once the container exists.
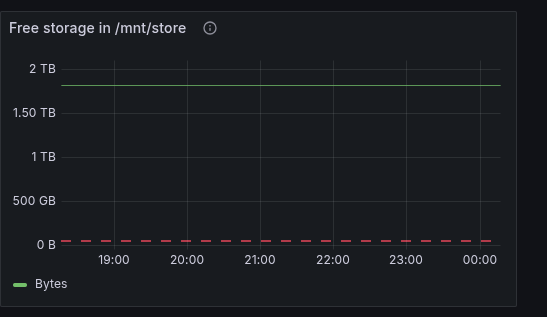
But once you restart Grafana, you’re all set! Prometheus metrics are now part of your data. Using these metrics, I’m tracking, for example, how much storage space is free on my main server.

Comments