Monitoring Home Network With Grafana, Loki, Prometheus, and Alloy in Docker (part 1)
Having gotten to three whole nodes in my home network, I’ve decided it’s about time to get some centralized monitoring going. To that end, I’ve gone with what I’m (vaguely) familiar with: the Grafana open source logs display and its accompanying pieces. Here, I’ll lay out approximately how I got working home monitoring set up after a couple missteps.
Part 1 will focus on everything except Prometheus and then we’ll come back to that one in part 2.
It ain’t much, but it’s home.
Pieces used
Broadly speaking, this system goes collection → storage → display. For this setup, I’ve used the following:
-
Alloy (collection): Alloy is a Swiss army knife data collector that can output to multiple storage systems. Why Alloy? No particular reason other than Promtail is deprecated (sidebar: a fact that it’d be nice if Grafana’s own Getting Started documentation could tell us before we set everything up with Promtail). Anyway, Alloy has a pretty good acquire → transform → output flow that’s pretty easy to get into.
-
Loki (storage): Loki takes lines of logs and some associated metadata as a key-value list. The metadata goes into a database index; the logs are compressed and stored. As a result, searches against Loki are fast against the data in the key-value store and slower against individual log lines (compared to having all your logs in text and just ripgrep’ing across them). This is important to know when using Loki: if you can dice your data by your key-value indicators, it’ll be fast.
-
Prometheus (storage): Prometheus is a time-series datastore; it stores values associated with specific points in time, and then lets you aggregate those values into statistical analysis. This differs from log lines mostly in the data density; time series datapoints are “pre-digested” so that the statistical analysis can happen fast with no additional transformation of the data itself (Grafana is capable of doing statistical analysis on data extracted from log lines, but since it has to run a transform on each log line to go from text to numbers, that’s slow). Alloy can emit to Prometheus in addition to Loki. I set up Prometheus in part 2.
-
Grafana (display): Grafana is capable of rendering data stored in multiple datastores (including Loki and Prometheus), building dashboards, and setting up alerts and notifications for unexpected events. This is my top-level.
The setup
Now that all the actors are in place, here’s how they’re set up on my system.
-
One node hosts Loki, Prometheus, and Grafana. For real robustness you want to spread that kind of thing out so the loss of one node doesn’t wreck your ability to get logs, but this gets me started.
-
Each node hosts an Alloy instance that does local collection and pushes everything off to the host node.
For each of these, I set up a small Docker Compose and a set of config files to get it going.
The host node
The host node has one compose file configuring the two containers and Grafana, living on a bridged network named loki.
services:
  loki:
    restart: always
    image: grafana/loki:3.4.1
    ports:
      - 3100:3100
    volumes:
      - type: bind
        source: ./loki-config.yaml
        target: /etc/loki/loki-config.yml
    networks:
      - loki

  grafana:
    environment:
      - GF_PATHS_PROVISIONING=/etc/grafana/provisioning
      - GF_AUTH_ANONYMOUS_ENABLED=true
      - GF_AUTH_ANONYMOUS_ORG_ROLE=Admin
      - GF_FEATURE_TOGGLES_ENABLE=alertingSimplifiedRouting,alertingQueryAndExpressionsStepMode
    entrypoint:
      - sh
      - -euc
      - |
        mkdir -p /etc/grafana/provisioning/datasources
        cat <<EOF > /etc/grafana/provisioning/datasources/ds.yaml
        apiVersion: 1
        datasources:
        - name: Loki
          type: loki
          access: proxy
          orgId: 1
          url: http://loki:3100
          basicAuth: false
          isDefault: true
          version: 1
          editable: false
        EOF
        /run.sh
    image: grafana/grafana:latest
    ports:
      - "3000:3000"
    networks:
      - loki

networks:
  loki:
    driver: bridge
All of this can be started with a simple docker compose up --detach once the config files are in place. The Grafana entrypoint executes a script that dumps a local ds.yaml file into the container that describes my Loki node. That’s a little silly; I can pull this out into another file living at a bound volume location, but this works okay. Worth noting is that Grafana is a little bit stubborn about changing the configuration of its sources after it boots up; it stores them to a local DB and changing ds.yaml doesn’t automatically update them even if you restart the node. If there’s a better way to address this I’d like to know what it is.
The config file for Loki is basically pulled from the Grafana tutorial:
auth_enabled: false

server:
  http_listen_port: 3100
  grpc_listen_port: 9096
  log_level: debug
  grpc_server_max_concurrent_streams: 1000

common:
  instance_addr: 127.0.0.1
  path_prefix: /tmp/loki
  storage:
    filesystem:
      chunks_directory: /tmp/loki/chunks
      rules_directory: /tmp/loki/rules
  replication_factor: 1
  ring:
    kvstore:
      store: inmemory

query_range:
  results_cache:
    cache:
      embedded_cache:
        enabled: true
        max_size_mb: 100

limits_config:
  metric_aggregation_enabled: true

schema_config:
  configs:
    - from: 2020-10-24
      store: tsdb
      object_store: filesystem
      schema: v13
      index:
        prefix: index_
        period: 24h

pattern_ingester:
  enabled: true
  metric_aggregation:
    loki_address: localhost:3100

ruler:
  alertmanager_url: http://localhost:9093

frontend:
  encoding: protobuf

# By default, Loki will send anonymous, but uniquely-identifiable usage and configuration
# analytics to Grafana Labs. These statistics are sent to https://stats.grafana.org/
#
# Statistics help us better understand how Loki is used, and they show us performance
# levels for most users. This helps us prioritize features and documentation.
# For more information on what's sent, look at
# https://github.com/grafana/loki/blob/main/pkg/analytics/stats.go
# Refer to the buildReport method to see what goes into a report.
#
# If you would like to disable reporting, uncomment the following lines:
#analytics:
#  reporting_enabled: false
Although these are running on a network named loki, that network is bridged so we can confirm Grafana is up by going to (in my case) bighost.home:3000 for the Grafana UI and bighost.home:3100/ready to healthcheck Loki.
We look good!
Alloy on all nodes
Every node that I want to monitor has its own Alloy instance running, which gathers data from various services. These are also running in Docker; I have a separate docker-compose-alloy.yml file for those configs.
services:
  alloy:
    restart: always
    user: root
    image: grafana/alloy:latest
    volumes:
      - type: bind
        source: ./config.alloy
        target: /etc/alloy/config.alloy
      - type: bind
        source: /var/log
        target: /var/log
      - type: bind
        source: /proc
        target: /host/proc
        read_only: true
      - type: bind
        source: /
        target: /host/rootfs
        read_only: true
      - type: bind
        source: /sys
        target: /host/sys
        read_only: true
    ports:
      - 12345:12345
    environment:
      - NODE_NAME=$HOSTNAME
    entrypoint:
      - /bin/alloy
      - run
      - --server.http.listen-addr=0.0.0.0:12345
      - --storage.path=/var/lib/alloy/data
      - /etc/alloy/config.alloy
    networks:
      - loki

networks:
  loki:
    driver: bridge
Two things worth noting here:
-
It took me entirely too long to remember that if I’m going to harvest data from logs, the Docker container needs to be able to see the host logs. Took me two hours to realize I hadn’t put the
/var/log:/var/logbinding rule in thevolumesstanza. -
I want logs sent to Loki to be tagged with the hostname of the source. By default, this doesn’t happen; the
NODE_NAME=$HOSTNAMEenvironment variable binds to a rule in the Alloy config that does the job. This requires me to run this compose asHOSTNAME=$(hostname) docker compose -f docker-compose-alloy.yml up --detach.
I actually have a heterogeneous setup at home; most of my nodes are Ubuntu, but one is actually a Debian instance, for reasons. So I have two different config.alloy files based on what kind of node I’m on. For the Debian machine:
/* Config for Debian */
local.file_match "system" {
	path_targets = [{
		__address__ = "localhost",
		__path__    = "/var/log/*log",
	}]
}

loki.source.file "system" {
	targets               = local.file_match.system.targets
	forward_to            = [loki.write.default.receiver]
	legacy_positions_file = "/tmp/positions.yaml"
}

loki.write "default" {
	endpoint {
		url = "http://bighost.home:3100/loki/api/v1/push"
	}
	external_labels = {
		node        = sys.env("NODE_NAME"),
    }
}
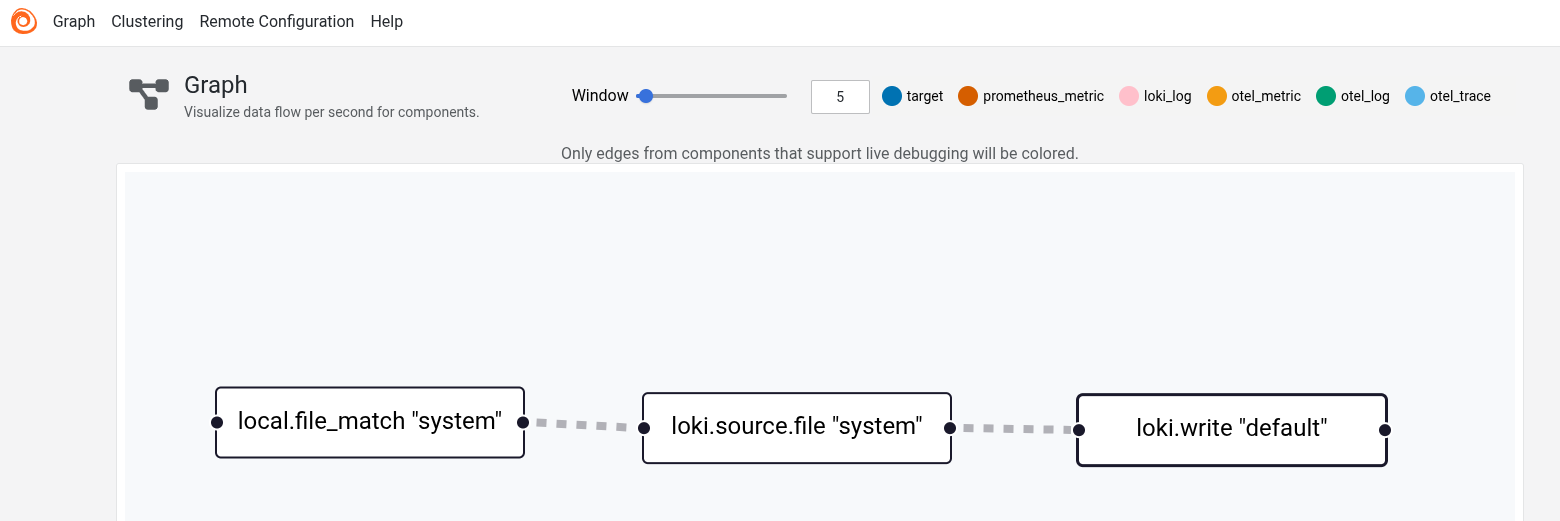
These three parts define the rules for identifying files to scrape data from, scraping that data, and hten writing that data out. local.file_match collects all the filenames matching the __path__ pattern. The identified files show up in local.file_match.<name of the rule>.targets. loki.source.file picks them up and generates individual log lines (with attached metadata). The legacy_positions_file is actually a holdover from the fact that I created a Promtail config first; there is a migration tool to build an Alloy config from a promtail config, and it creates a starting point for log harvesting so that Alloy won’t re-harvest anything Promtail already harvested. This rule both specifies which files to read and what rule to send the log entries to (forward_to).
The final rule, loki.write, specifies what URL to emit the logs to. We can add additional key-value relationships with external_labels; the one I add identifies the hostname as node by pulling the value we set in the environment hen we spun up the Docker container.
Once Alloy is spun up, it creates an endpoint at port 12345. I can look at bighost.home:12345 to confirm Alloy is online. The UI provides some pretty diagrams of what is running.

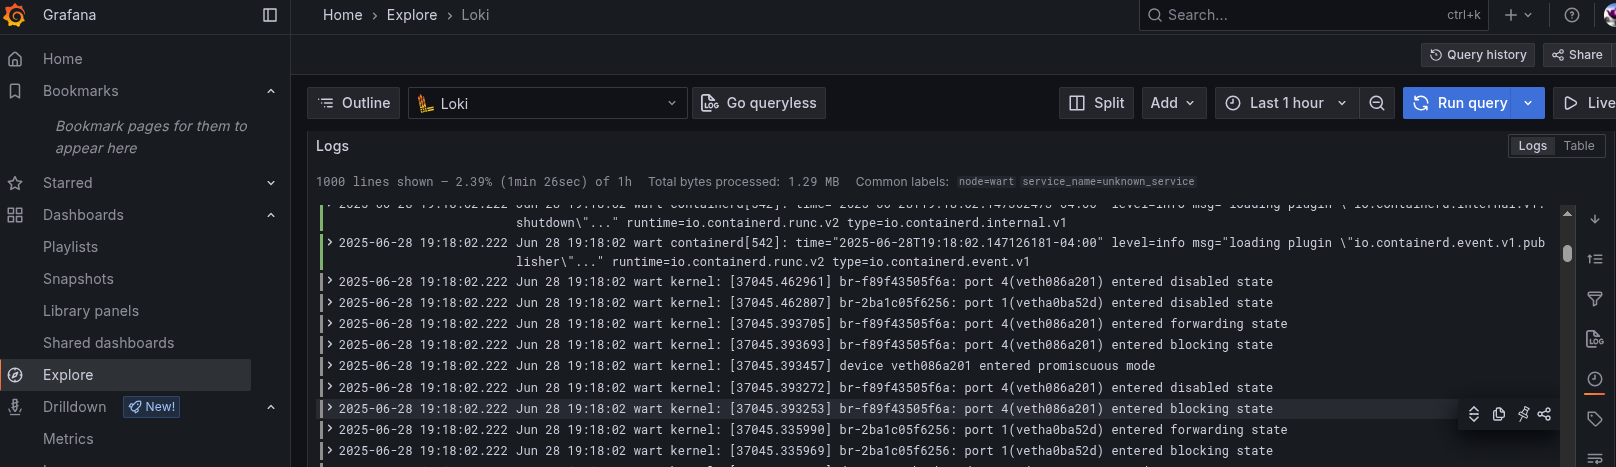
With all the pieces spun up, we can switch over to Grafana and see the logs coming in.

For the nodes running Ubuntu, I can additionally scrape the logs from systemd. There are just a couple more rules to do that.
loki.relabel "journal" {
  forward_to = []

  rule {
    source_labels = ["__journal__systemd_unit"]
    target_label = "unit"
  }

  rule {
    source_labels = ["__journal_errno"]
    target_label = "errno"
  }

  rule {
    source_labels = ["__journal_priority_keyword"]
    target_label = "severity"
  }
}

loki.source.journal "systemd" {
  forward_to = [loki.write.default.receiver]
  relabel_rules = loki.relabel.journal.rules
  path          = "/var/log/journal"
  labels = { component = "loki.source.journal" }
}
The systemd scraper has a flow a little backwards from the local file scraper: it pulls in relabeling rules from a loki.relabel module. This remaps labels in journal’s format to more common labels. Finally, the loki.source.journal module gets the data from /var/log/journal, relabels it, and forwards it on to the same receiver as the rest of the logs.
That’s enough to get us some basic capture of log data. In a subsequent post, we’ll talk about capturing time series data as well using Prometheus.
Comments